Effective solar monitoring is the difference between a high performing portfolio and one that silently loses revenue year after year. For asset owners and operators managing commercial or utility scale plants, monitoring is not about green lights on a dashboard; it is about maximizing the return on every panel, every inverter, and every dollar invested, with evidence instead of assumptions.
Here are the practices experienced solar operators follow.
1. Monitor at the right granularity
Industry best practice is 30 second to one minute collection for critical parameters: production, irradiance, and inverter status. Coarser intervals, such as fifteen minute averages, mask transient faults, partial shading, clipping, and equipment cycling that explain where energy went. At minimum, collect per inverter AC output, DC voltage and current per MPPT input, plane of array and global horizontal irradiance, ambient and module temperature, revenue meter readings, and tracker position where applicable.
2. Verify performance against measured irradiance
Production numbers alone do not tell you whether a plant is performing; a megawatt can be excellent under clouds and alarming under clear sky. The discipline that resolves this is the performance ratio: actual energy divided by the energy expected from measured irradiance, as defined in the IEC 61724 standard for photovoltaic system performance monitoring (IEC 61724). Maintain calibrated irradiance sensors, ISO 9060 defines the accuracy classes (ISO 9060), and let the platform compute the comparison continuously and flag deviations automatically. This one practice converts monitoring from reporting into verification; our guide to the solar energy management system covers the machinery behind it.
3. Implement tiered alarming
Alert fatigue is real: operators who receive hundreds of low priority alarms a day eventually ignore all of them, including the one that mattered. Structure alarms in tiers with expected response times:
- Critical: safety issues, equipment damage risk, complete outage; immediate response
- High: significant production loss, an inverter down or tracker stuck; same day
- Medium: string underperformance, communication loss; within 48 hours
- Low: sensor drift, cosmetic faults; scheduled maintenance
Review thresholds quarterly; an alarm that never fires and an alarm that always fires are both miscalibrated.
4. Track degradation over time
Solar equipment degrades, and the rate varies more than most owners expect. NREL's field research places the median module degradation rate near half a percent per year, with a wide distribution across products, climates, and system designs (NREL degradation review). Track weather normalized performance year over year per site; a plant losing energy faster than the expected band has a problem worth finding, whether it is modules, connectors, or soiling, and warranty windows reward finding it early.
5. Watch soiling deliberately
Soiling, dust, pollen, agricultural debris, and ash, commonly removes a few percent of annual energy and can take far more in dry or dusty regions; NREL's soiling research documents both the average and the extremes (NREL soiling research). Treat cleaning as an economic decision: model the energy recovered against the cost of a wash, use rain and site data to update the model, and schedule cleaning when the numbers say so rather than by the calendar.
6. Benchmark across the portfolio
If you operate multiple sites, peer comparison is one of the most powerful tools available. Sites in similar climates with similar equipment should perform similarly; when one underperforms its peers, that is a signal worth investigating even if the site looks fine in isolation. Portfolio benchmarking also exposes systemic issues, a bad component batch, a design flaw, that single site views cannot see.
7. Ensure data integrity
Gaps in monitoring data undermine everything else on this list: performance analysis, degradation trends, warranty claims, and incentive reporting all assume a continuous record. Use edge devices with store and forward capability, local loggers that cache data through network outages and backfill automatically when connectivity returns, so remote sites with unreliable links still produce complete records. Validate sensors against each other and against satellite irradiance to catch drift.
8. Automate reporting
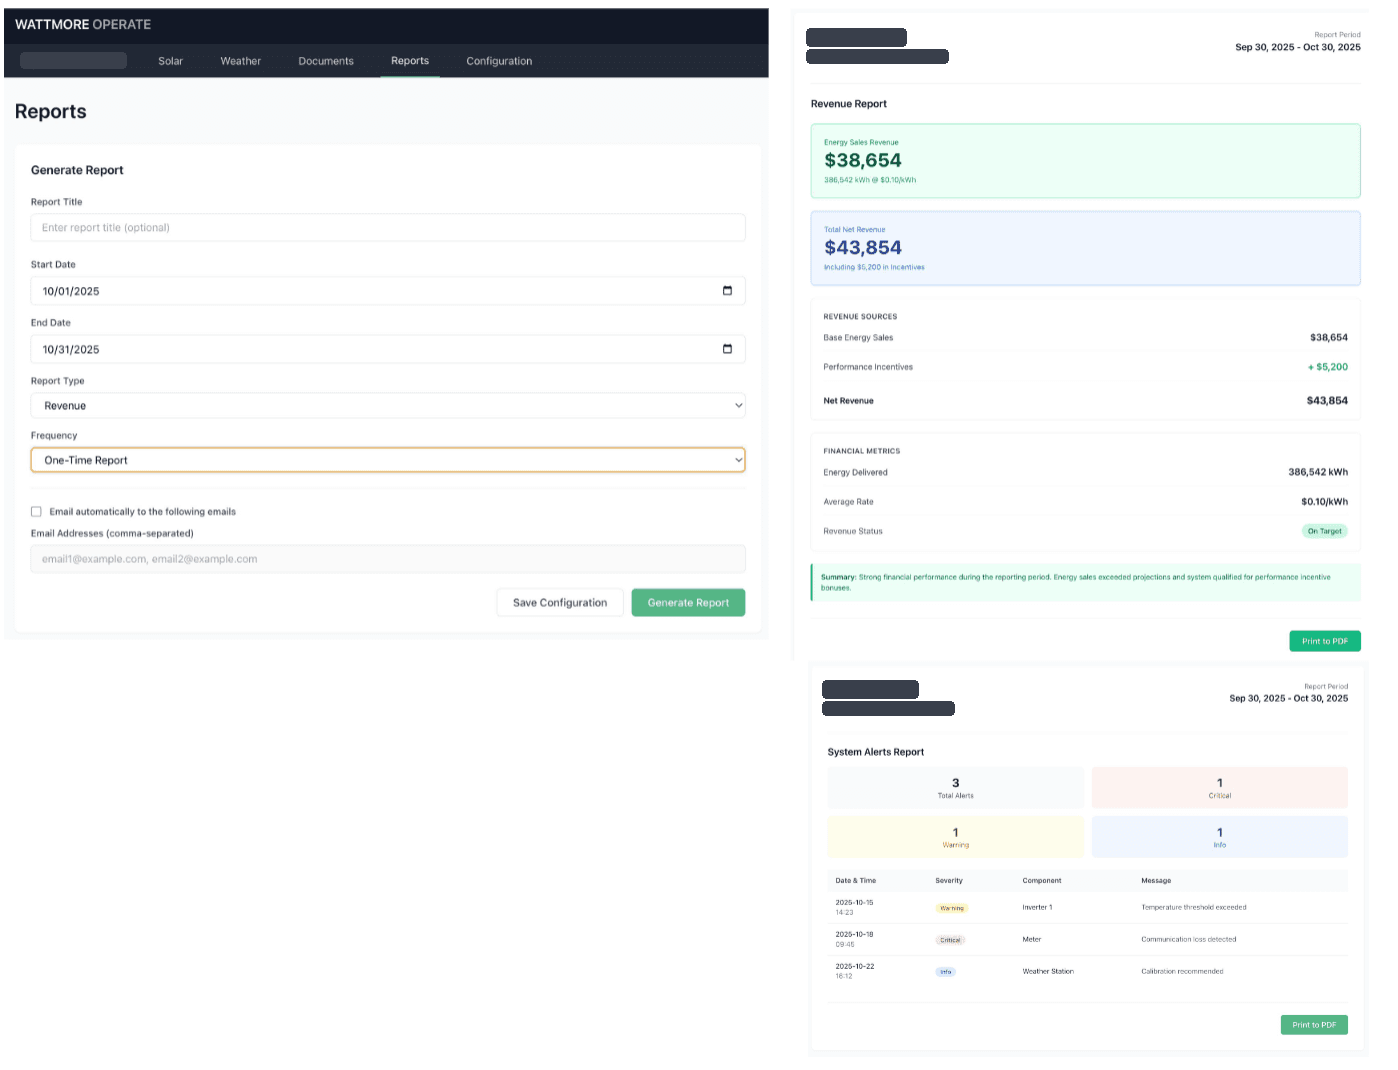
Investors, offtakers, incentive programs, and management all need regular reports. Automate them, monthly performance, quarterly investor updates, annual degradation analyses, so they are consistent, on time, and cheap to produce. Programs like California's SGIP add their own data requirements; a platform that is already an approved performance data provider removes that burden entirely.
Putting it into practice
WATTMORE's Intellect EnFORM implements these practices in a single vendor agnostic platform: 30 second data, automated performance verification, tiered alarming, portfolio benchmarking, store and forward logging, and automated reporting, across any mix of equipment brands. Contact us to see how it would run your portfolio.